
Shifting Tech-tonics
Feel the Earth Move Under your Feet

[For best visualization, read on the website here]
Go ahead. Turn it up! At least for the first twenty-five seconds. Do it!
If Carole King’s 1971 classic doesn’t move the earth under your feet, then there is something wrong with you. What would be worse is if you haven’t yet felt the gyrations beneath the surface of the capital markets. The investment landscape is changing.
No worries, though, Dear Reader, the wolf’s seismometer is working. He will report these reverberations to you in today’s straight-to-the-point post.
What shifts are occurring?
Consider the relative performance of three investment themes we discussed last year (with honorable mentions to two others).
1. TECH x S&P
Remember this eye-catching post?

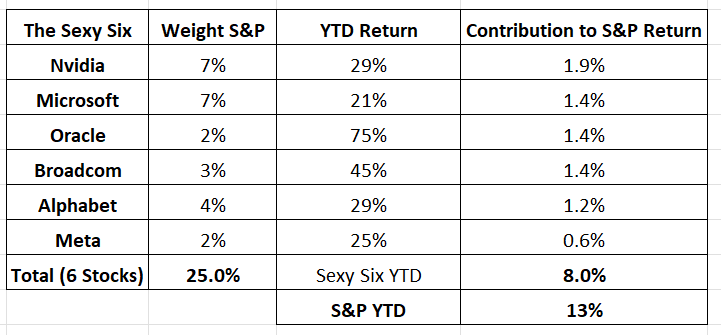
In it, I replaced the standard market nomenclature “Magnificent Seven” with the term “Sexy Six” to identify the six stocks that had contributed most to the year-to-date S&P performance.
Here is a table from that post:
Now, let’s look at the same table, but for the period from September 28th, 2025, to last Friday.
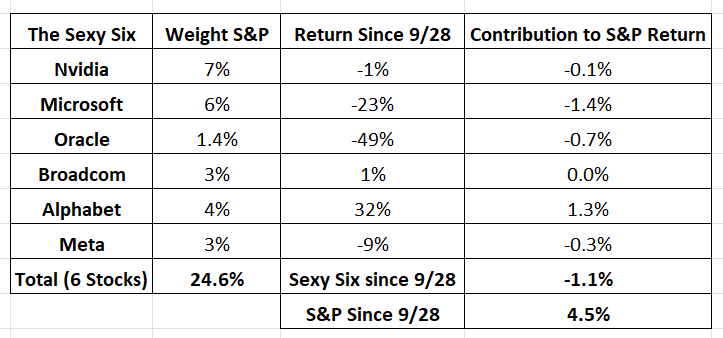
We should rename the Sexy Six the “Frigid Five!" Unless you were an exceptional stock handicapper and chose Google (Alphabet), you made nothing long Nvidia and Broadcom, and you lost your shirt with Microsoft, Oracle, and Meta.
Let’s look at this graphically by plotting the ratio of the Nasdaq (tech) to the S&P. The upward-sloping white line indicates outperformance of the Nasdaq, and the downward-sloping line indicates underperformance.
Nasdaq x S&P
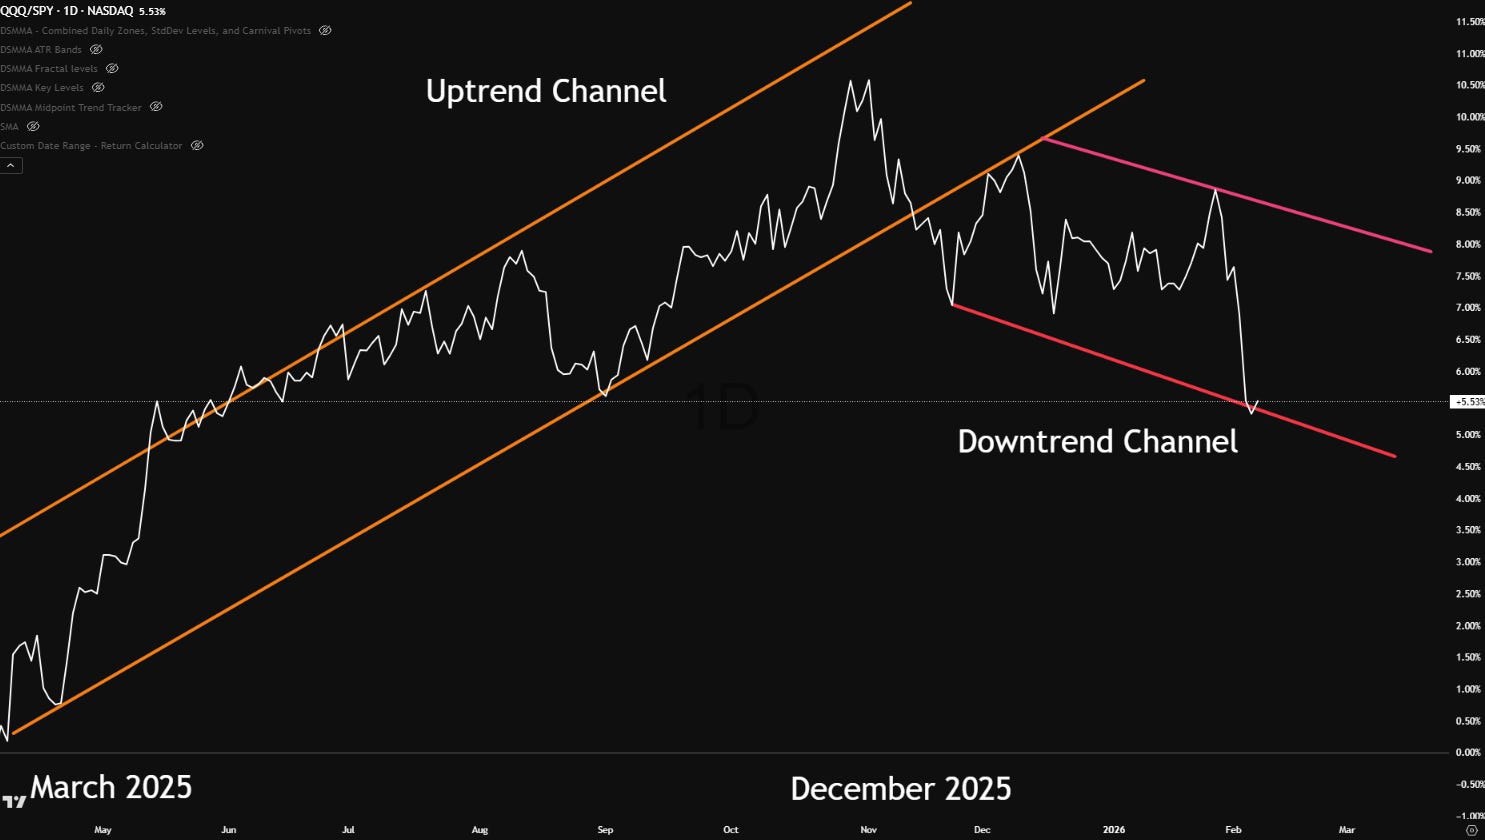
Something happened at the turn of the year that resulted in changes in investor flows.
2. ENERGY X TECH
Like Carole King’s “I Feel the Earth Move,” this post about the energy sector is an oldie but a goodie.
Here, I presented the investment merits of the US energy sector ETF, “XLE”. Specifically, XLE offered an asymmetric return, given that its price/earnings multiple was about 15, and its dividend yield about 3.5%. XLE had more upside than downside, according to that analysis.
Let’s see how XLE has performed relative to the Nasdaq since that post:
Energy x Tech
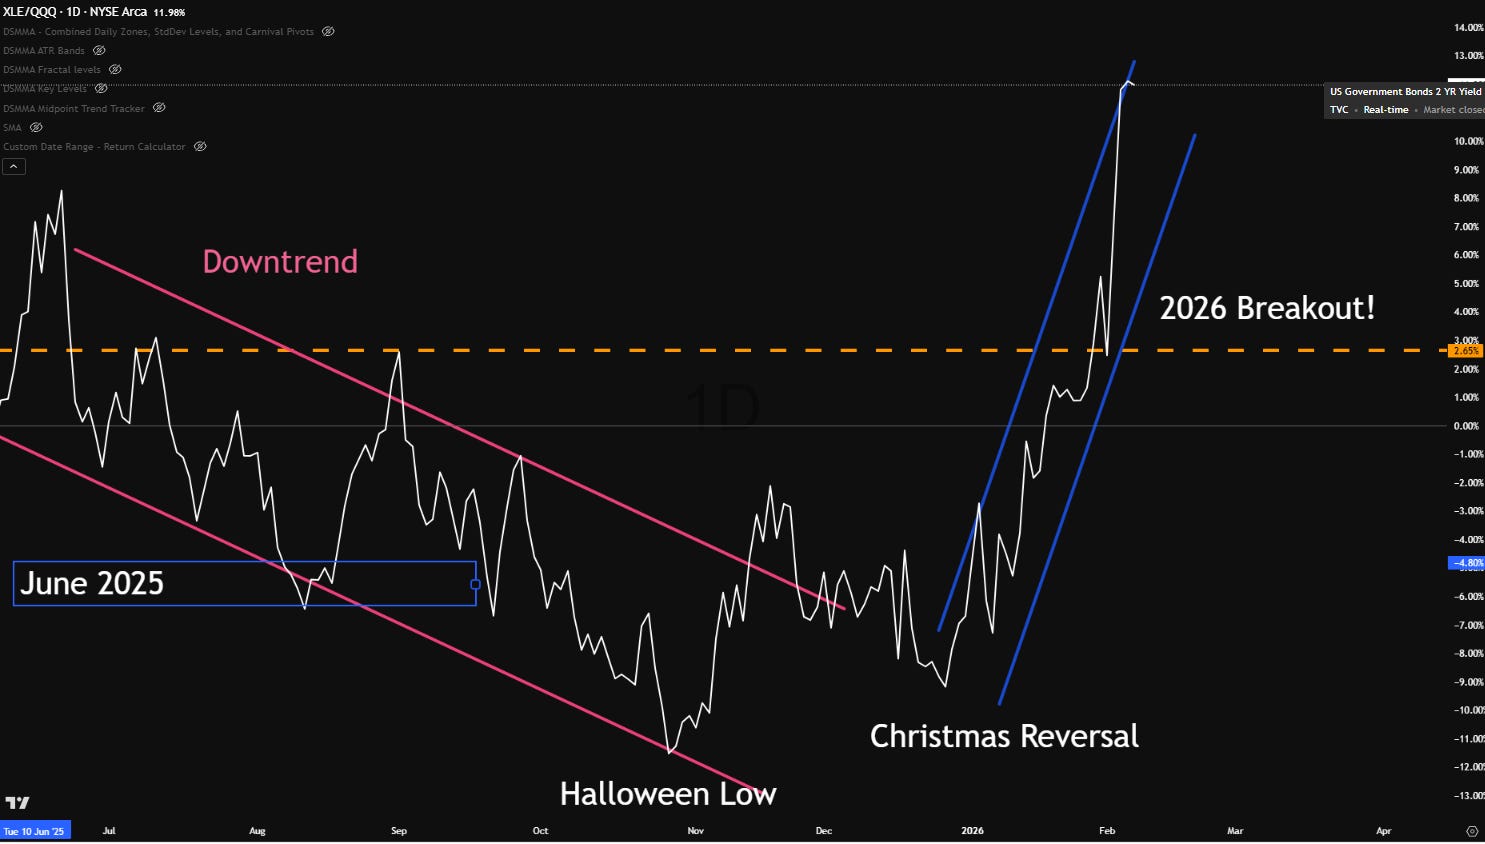
Since that post, XLE is +27%, and the Nasdaq is +16%, with the sharp reversal of fortunes again occurring around Christmastime.
An 11% outperformance for an ETF with lower volatility is investment nirvana and a wonderful example of patience paying off.
3. S&P versus Rest of World (“ROW”).
Last June, I devoted a post to Asset Allocation.

Its conclusion was the formulation of a “model” portfolio, reprinted below:
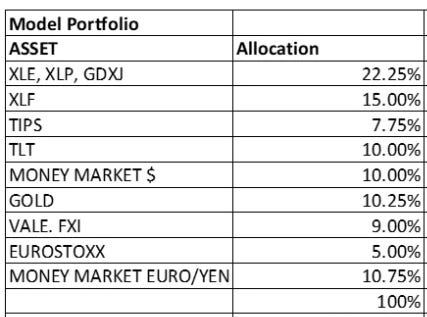
In addition to XLE, the portfolio held gold and GDXJ, the Junior Goldminers ETF. Since this post was published, gold is +46% and the goldminers +84%. The goldminer phenomenon was examined closely in the post “Why are the Goldminers Exploding?”

But our focus is not on gold, it is on the ROW, which in the case of this model portfolio refers to EuroStoxx (European Stocks), the Euro, and the Yen.
The performance of each since that post has been a mixed bag.
To compare US Stocks to ROW stocks, the ETF “VEA” is an excellent reference, and is now part of my portfolio.
VEA holds the stocks of about 3000 companies that operate outside of the United States. Let’s compare VEA to the S&P:
Rest of World x S&P
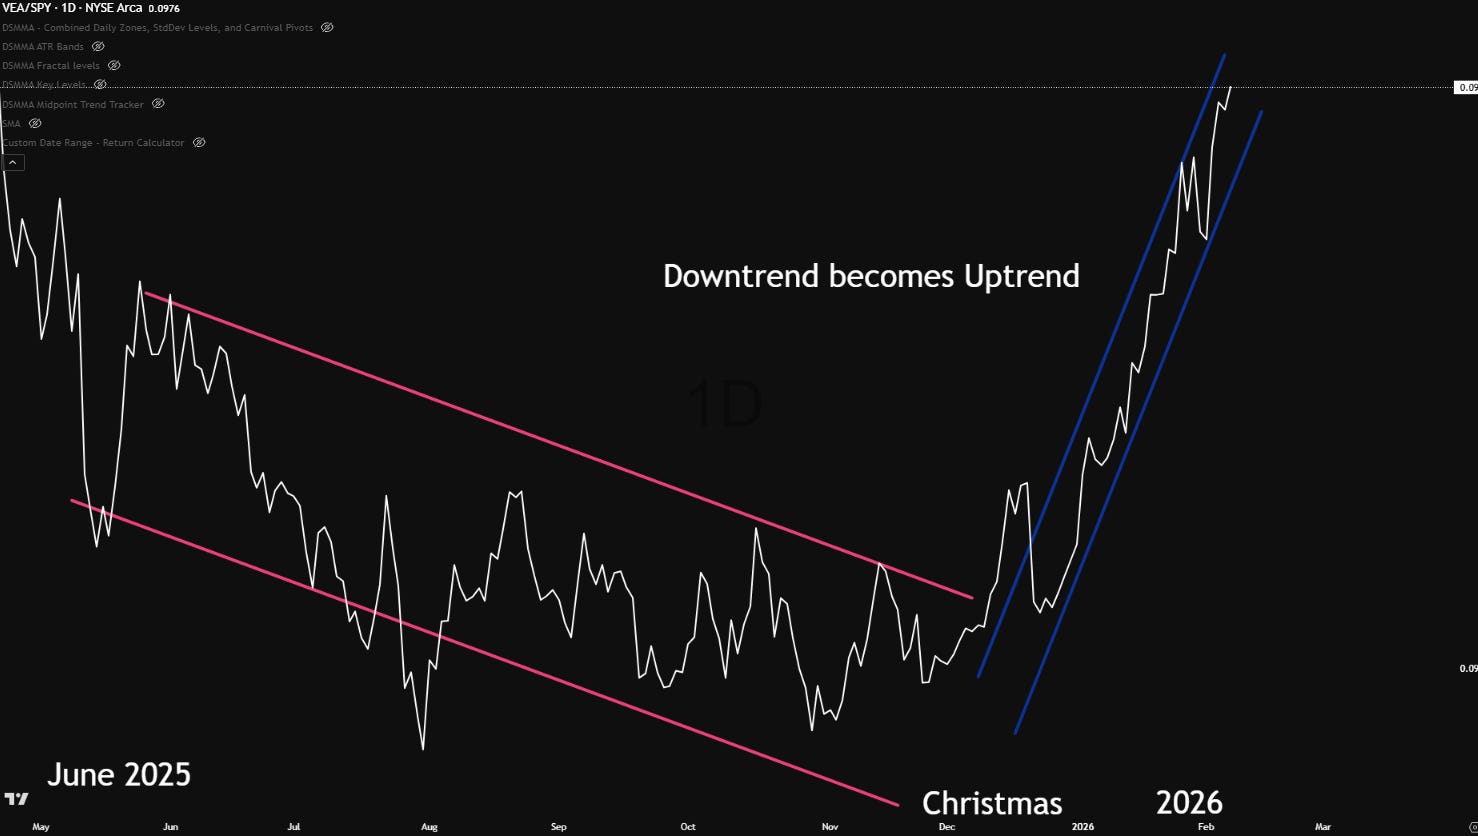
Look familiar? Since mid-December of last year, “ROW” stocks have left the US stock market in the dust.
Asset Allocation: Will the Rotation continue?
The salient question is whether the flow out of tech into other sectors is likely to continue. In the case of XLE, its recent run-up has taken away some of the value identified back in June. After all, it is more than 25% more “expensive” on an absolute basis. Its risk/return profile is not as asymmetric as it was back in June (sorry for the double negative).
The same is true for VEA.
The Nasdaq now trades around 30x trailing twelve months earnings, while both XLE and VEA trade around 18x. Of course, comparing P/E’s is misleading when earnings growth rates differ significantly, and Nasdaq earnings are growing much faster on average than the earnings of the holdings in XLE and VEA.
But, in the land of the blind, the one-eyed investor is king. And there still is value as seen through the monocle of old-fashioned valuation and the bifocals of this old-fashioned boomer.
Just as important is the newfound momentum the non-tech sectors have shown.
Newton didn’t opine (to my knowledge) about earthquakes, but he did teach us that an object in motion tends to stay in motion, and that very well may apply to the performance of XLE and VEA.
Value + Momentum = good risk/reward.
What changed investors’ minds as 2025 became 2026?
Here are six factors that contributed to the tech-tonic shift:
Big Tech is funneling hundreds of billions of dollars into capital expenditures, and there is little visibility of what return on investment (ROI) to expect.
Supply constraints could trip up AI progress. Electricity is the factor most commonly cited, but recently, a shortage of RAM and DRAM has shot memory prices up and is a threat to the hyperscaler’s production.
What was heretofore a one “AI” trade has morphed into picking winners and losers. That requires higher discernment from investors and implies lower allocations to the sector.
Over the next six months, both OpenAI and SpaceX will likely launch IPO’s. That represents hundreds of billions of dollars of potential supply. Because the AI arms race depends so heavily on CapEx, there is less money around to buy back shares.
More supply + Less Demand = Lower Prices.
The massive CAPEX spend will also require higher borrowing by the AI leaders in the institutional debt markets, another source of AI-related investment supply.
Trump’s foreign policy posture continues to be erratic: insulting Europe and Canada, threatening to invade Greenland and Cuba, etc. This not only startles allies, but it rattles international investors.
A weak dollar results in higher allocations to non-dollar investments.
In addition to these reasons, I highlighted some of the risks to the “AI” trade in the post entitled “Revolutions” on November 24th, which is worth a re-read if you have time. It compares the AI revolution to the shale oil revolution of the 2010’s, where over-investment ended in tears for investors.

Here is a nice way to summarize this discussion:
For the past couple of years, investors have depended on the tech sector for investment success; today, the tech sector depends on the investor for its economic success.
Portfolio Implications
My Beta (long-term) portfolio has captured these movements. Better lucky than smart. More importantly, I am staying the course.
I maintain aggressive allocations to XLE, VEA, Eurostoxx, and significant cash deposited in Japanese Yen, British pounds, and Euros.
I have reduced (but not eliminated) my exposure to tech over the past several weeks.
I own much less gold than I did six months ago and have sold all my goldminers (way too early).
I do not like to “brag” about the performance of my portfolio. I do not publish my complete investment holdings, nor do I report my individual investment performance - because it would be unverifiable. Having investment ideas is easy - putting them into practice to achieve one’s investment objectives is the hard part.
There is an old saying on Wall Street, “My word is my bond.” In other words, a buyer and a seller could be sure their trade would settle because each had said it would.
Here, in this newsletter, my word is also my bond. If my writing occasionally inspires you to invest with more responsibility and knowledge, then the contract between us has been fulfilled.
Dear Reader, the earth is moving under YOUR feet. Look at your portfolio. Is it ready for the oceans, rivers, waterfalls, mountain ranges, and deserts that might be forming?
Thank you for your time. Leave a like if this post has inspired you.
Great post, and another great musical reference! Thks for the portfolio "review"... XLE was indeed a great call. abraço!