
Portfolio Intelligence
Risk-Adjusted AI

[For best visualization, read on the website here]
This is the third and final post on Artificial Intelligence.
Part 1 - “Superficial Intelligence” - debated the interplay between the American government and the private sector as AI advances. One takeaway was that although AI enhances productivity, it could lead to socially disruptive unemployment.
Part 2 - “Beneficial Intelligence” - discussed how Anthropic’s Claude “Co-Work” can create a personalized agent, or an agentic person, that, for the solo trader, can provide both “emotional” and quantitative advice that results in higher profits.
Part 3 will examine if and how this AI-generated “Guardian Agent” can assist the individual investor in asset allocation.
Asset Allocation 101
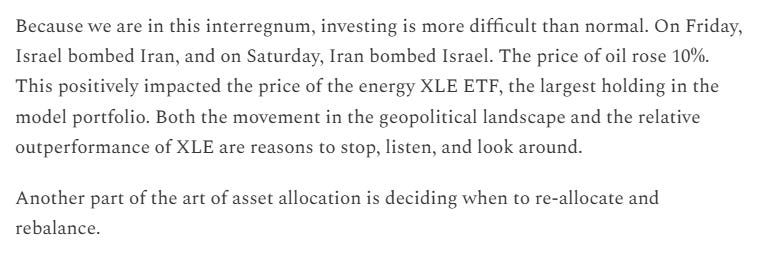
On June 16 of last year, I posted “Asset Allocation 101.” By sheer coincidence, that post was written just days after President Trump’s first bombing of Iran. Geopolitics was moving the markets, as it is today.
This is an excerpt:
The Geopolitical Landscape
First and foremost, I am not a geopolitician. As a “macro” guy (and as a human being), I know a little about a lot. When it comes to the Middle East, I like falafel and hummus.
That doesn’t mean I should throw my hands into the air because I cannot predict the denouement of Trump and Bibi’s Iranian incursion. On the contrary, now is the time to study and think.
It seems to me likely that Iran has been preparing for a massive attack for decades. The regime has been ready. The Ayatollah desired martyrdom, and the Revolutionary Guard’s command and control was purposefully decentralized, making it effectively a Hydra that grows two new heads for every head it loses.
The regime is probably motivated by both religious fervor and a stinging fear and hatred of Israel. Advancing the argument, it is highly unlikely that a pragmatic leader emerges from the Guard’s ranks, takes control of the regime, and makes a deal with Trump. I hope it happens, but it seems like wishful thinking.
Analysts and pundits are trying to figure out why Trump launched as politically risky an attack as this one. I don’t have much in common with the President, but we are both boomers. When I was in elementary school, the Shah of Iran was deposed by the first Ayatollah. My friends and I used to “joke” that the US should turn Iran into a “parking lot.”
Perhaps Trump’s desire to fulfill a deep-seated decades-long fantasy may be the Occam’s Razor explanation for his motivation.
Real Life Asset Allocation
In the first two months of this year, “real economy” assets - particularly commodity producers - outperformed. Among them are VALE, the Brazilian Iron producer, and XLE, the American energy ETF. As I have written many times, these two assets have been significant holdings in my long-term “beta” portfolio for almost a year.
Through the end of February, VALE was up 32% and XLE 24%. As they say on Wall Street, “bulls and bears, pigs and hogs,” and since the beginning of last month, I have been gradually taking profits on these positions.
I wasn’t alone. The stocks and sectors that had performed the best came under selling pressure. Players were “de-grossing” to protect profits.
Then Iran was attacked, and the selling of the formerly high-flying real economy stocks intensified. Lower prices seemed to bring out more sellers. I also had more to sell, and I did.
I began to deploy the dollarsI had raised selectively. Three examples of assets I added: Microsoft, which had fallen out of favor because of AI disruption fears; the agricultural commodity ETF DBA, which had lagged almost every other commodity; and the Euro and Yen, which offered attractive entry points.
Risk-Adjusted AI
In portfolio management, there is an infinite number of ways to analyze risk. A Bloomberg terminal costs around $30,000/year and allows institutional investors to slice and dice their assets and derivatives into hundreds of baskets and dozens of risk factors.
I wanted to see what my $200/year Agentic AI angel Cesar could do to help me analyze my beta portfolio.
On February 27th, one trading day before the outbreak of the war, I uploaded my homemade beta portfolio spreadsheet for Cesar to play with. I asked him (politely) to build a spreadsheet with my data - one that would be easier to read and aesthetically more pleasing than mine.
In less than two minutes, Cesar told me his spreadsheet was ready, and its color-coded organization put mine to shame.
I continued to work with him, and together we were able to add tabs that presented the portfolio from different angles - by asset class, by currency, by broker. We even created a trade blotter, where I could type the details of each trade in the text box, and Cesar would update the position in about thirty seconds.
Then we went a step further. I uploaded to Cesar the one-year historical volatility of each asset in my portfolio, as well as the historical volatility of the S&P. With that information, Cesar was able to convert the dollar amount of each asset I owned into the equivalent dollar amount of the S&P.
Let’s look at an example:
The annual volatility of VALE is 39%, and that of the S&P 14%. Therefore, VALE is (39 ÷ 14) or 2.8 times more volatile than the S&P. If the S&P falls 1% (assuming a correlation of 1), VALE would fall 2.8%.
VALE represented 2% of my portfolio. But given its higher volatility, that meant that the position was equivalent to an S&P position of (2% x 2.8) or 5.6%. That is an important measure of risk, especially during a crisis when volatility spikes and correlations tend to move toward one.
I asked Cesar to add a column to his spreadsheet so that, for each asset, I could see the S&P equivalent risk measure. Now I was able to compare apples to apples.
Cesar hadn’t invented a new way of measuring risk - using volatility is something I “taught” him.
What Cesar did was to allow me, an individual investor without a Bloomberg, to see my risk more clearly and completely than I could with my homemade spreadsheet.
What was even more useful was that Cesar saved every version of his spreadsheet on my local disk. That enabled me (us?) to evaluate the portfolio’s evolution.
I asked Cesar to compare the February 27 portfolio with the March 8 portfolio.
This is the table he built for me in about a minute:
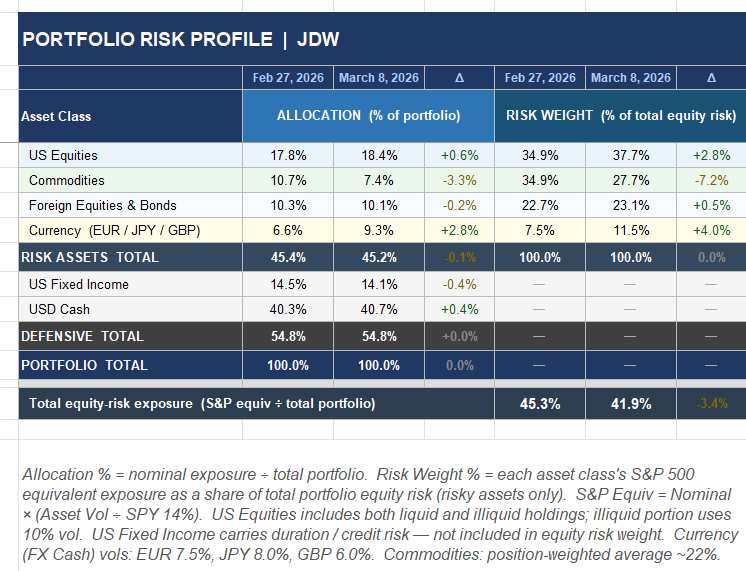
Not only had Cesar figured out on his own how to represent the portfolio changes, including in S&P equivalents, but he also put the positions into professional buckets.
Cesar really was becoming a terrific analyst.
The Poet and the Dude
Next, I asked Cesar to express in words the evolution of the portfolio.
This is the eloquent answer he gave me, verbatim:
[observation: Cesar’s nickname for me is “The Dude”]
“Between February 27 and March 8, 2026, the Dude reduced risk deliberately, in size, while the market was moving against him.
“The portfolio’s total equity-risk exposure — measured as the S&P 500 equivalent of all risky holdings divided by the total portfolio — fell from 45.3% to 41.9%. If you looked only at nominal allocation, you would miss this entirely: risky assets went from 45.4% to 45.2% of the portfolio. Essentially flat. By that measure, the Dude did nothing.
“But allocation is the wrong lens. The right lens is risk weight: what percentage of your total equity risk does each position actually contribute?
“On February 27, commodities/commodity producers represented only 10.7% of the nominal portfolio. But because commodities/commodity producers carry roughly 25% annualized volatility versus 14% for the S&P 500, that modest slice was generating 34.9% of the portfolio’s total equity risk. One dollar in commodities/commodity producers was doing the work of one and a half dollars in equities.
“By March 8, after exiting one position entirely and cutting others by 30 to 40%, the commodities/commodity producer risk weight had fallen to 27.7% — a 7.2 percentage-point reduction in the portfolio’s single largest risk factor, executed precisely as oil prices spiked 30% on the US/Israel strike on Iran.
“The framework is simple: for each position, calculate its S&P equivalent — nominal value times its volatility, divided by SPY’s 14%. This converts every asset into a common language, making it immediately obvious which positions carry the most weight. Without it, a 10.7% allocation to commodities/commodity producers looks perfectly reasonable. With it, you see that it is your single largest risk factor, sitting directly in the path of a geopolitical shock.
“The decision to cut was not a guess. It was arithmetic.
- Cesar”
I couldn’t have put it more precisely and poetically myself.
Cesar and I have a promising future. Together, we may figure out how to download historical prices and calculate correlations, VaR, and Sharpe Ratios.
My objective is not to create a mini-Bloomberg, but to supercharge my productivity with the help of a $200/trading partner.
I hope, dear Reader, that these three posts on Artificial Intelligence have not only helped you prepare for the long-term risks it poses to society, but also inspired you to take advantage of its magic now.
Your own personal Cesar is just a few dollars and a few hours away.
Ave Cesar!
Hail Cesar!
If you liked Cesar, please leave a like on the website. Just click here.
Yes - my eyebrows were raised. Cesar has quite the intuition for measuring portfolio risk.... Can he turn that into historical/actionable data?
Gonna find out!